
Currently, Getting Started With Python: Awaiting the funding for the Paint Flow Control Project, I've been working on a simulation program for the Fuzzy Logic control algorithm. I had been using an evaluation copy of National Instruments LabWindows/CVI program but the extension ran out and, since our project is still unfunded I thought I would develop a similar program using Python Dive Into Python) and there's plenty of videos and other Python info online, so I dove right in.

For my simulation code, I would need a GUI that would allow me to enter a Setpoint for the paint flow and other values such as the system response and others, plus show the computed flow values and display a graph of the computed flow. Python includes a GUI design capability with Tkinter (Tkinter) that I figured would be adequate for the labels, buttons etc that I would need. And I was aware of the graphing program matplotlib (matplotlib) that is available for use with Python, so decided to try to incorporate a graph into my GUI using matplotlib.
I had signed up with Lynda (Lynda) in order to learn Python, Java and other stuff, so began watching their Python courses. Fortunately their Python course includes an introduction to Object Oriented coding for Python, plus they have a Tkinter course to get me started. I found the Lynda courses to be very useful getting started with Python, giving me some confidence that I could develop my Fuzzy Logic simulation code in Python. After reviewing the info in "Dive Into Python" I then viewed the Lynda Python course on Python 3 (Python-3) and followed it up with their Tkinter course (Tkinter). I had decided to use Python 3, figuring that it was the Latest and Greatest. However, I found out later that Python 2 would probably be adequate for my tasks.
I downloaded version 3.4.3 from the Python website and while viewing the Lynda courses, I began developing my Python code from my old LabWindows/CVI code, including the "Widgets" for the labels and entry values. I was able to quickly get my code running, doing the Fuzzy Logic simulation and was ready to include a graph of the simulation results. Including a matplotlib graph was a big stumbling block even though the matplotlib website has a lot of examples for graphs and chart.
matplotlib installation
But I hadn't even installed matplotlib on my PC. I tried installing matplotlib but since I was/am such a Newbie, I ran into difficulties. Checking the matplotlib website, they suggest using the free downloads from either Canopy (Canopy) or Anaconda (Anaconda) to install all the necessary programs to run matplotlib.So I first installed Canopy but after using it for a couple of days, I realized that Canopy uses Python version 2.7.X and since I had planned to use Python 3, I then decided to install Anaconda which uses version 3. Most likely, version 2.7.X would be perfectly adequate for my tasks but being ignorant of the differences between vers 2.7.X and 3.4.3, I decided to drop Canopy and install Anaconda which uses version 3.4.3. Then I began trying to use Anaconda but ran into some coding difficulties and assuming that it was an Anaconda problem, I decided to stop using Anaconda and find some other way to install matplotlib. I don't know what caused my problems with Anaconda, but I simply assumed that it "had to be an Anaconda problem" and couldn't possibly be my coding inadequacies :-). Anyhow, I searched around and found an "edu" website that a matplotlib installation (Worchester Polytechnic Institute) and decided to give it a try. Although either the Canopy or Anaconda installation would probably have been adequate, the Worchester installation has been a godsend and I was finally able to make headway in my code development.
matplotlib Code Development
Although there are plenty of examples on the matplotlib website, those examples used pyplot and I didn't want to use pyplot as I believe it produced charts on separate windows, separate from the main window of the GUI. had already started my code development following Youtube videos by Sentdex (Sentdex). Sentdex's first videos used pyplot but later ones seemed more suited to what I wanted to do and I began massaging my code to be closer to his examples (Sentdex matplotlib example). His subsequent example was even closer to my needs, but he is using multiple pages and displaying the graph on a secondary page, whereas I wanted to have my graph in a frame on the main page of my GUI (). However, Sentdex provides some very useful information including the use of OO coding in his examples. Sentdex's video on a Live graph was very useful to me, showing me the way to "animate" my graph (Sentdex Animation Graph).
 |
| Sentdex's Graphing Video at https://www.youtube.com/watch?v=JQ7QP5rPvjU |
My Python Fuzzy Logic Simulation
I have to admit that I was overwhelmed with all the info from Sentdex's videos and also I made several goofs in my code, particularly trying to use a variable before I had defined it. And I was confused about how to make a Global variable in Python. I wanted to make some Globals, although globals are frowned upon in OO programming, but I couldn't think of another way to initialize some variables. In Sentdex's Animation video, mentioned above, he is graphing data that he reads from a disk file. For my code, I wanted to save the simulation data somehow in memory rather than writing and reading disk files and finally hit on the idea of global lists for the x and y simulation data. That seems to work very well and saves on wear and tear on my hard disk.
Anyhow, I don't want to include the whole simulation code but here's the first few lines showing the import of matplotlib, tkinter, etc, the globals for the xList and yList values and the animate graph code. The code turned out to be fairly simple and works quite well for my simulations.
 | ||
|
 |
| GUI with graph from my Python Simulation code. |
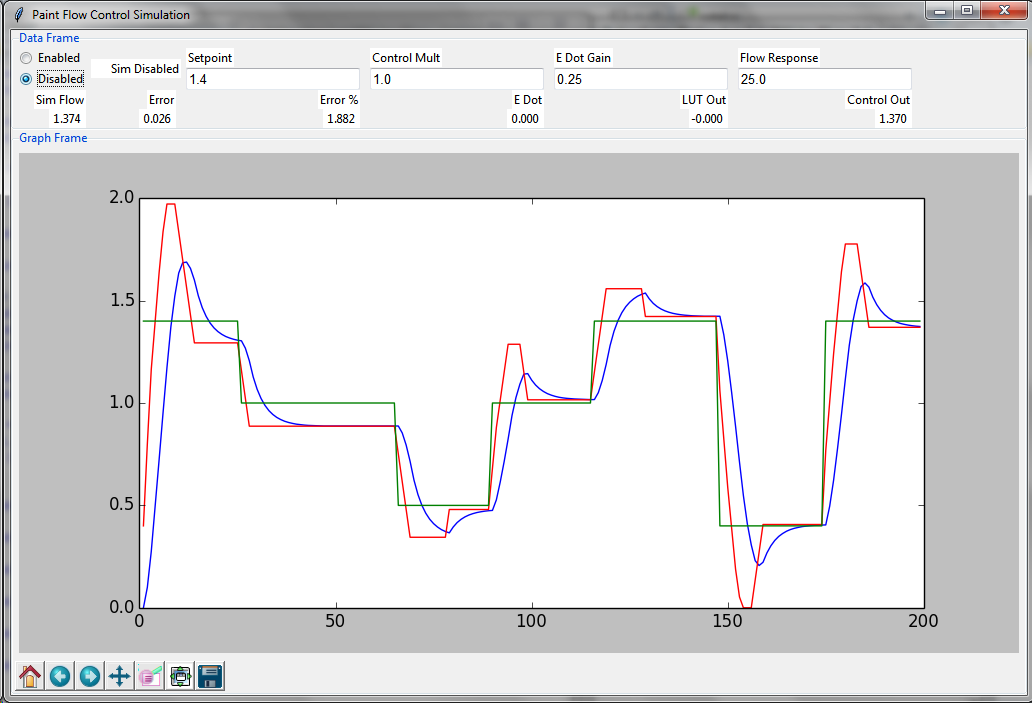 |
| GUI with graph showing the setpoint (green), output control signal (red) and simulated flow (blue). |
t the blog is about Paint Flow Control Project, Python and Fuzzy Logic Simulation #Python it is useful for students and Python Developers for more updates on python follow the link
ReplyDeletePython Online Training
For more info on other technologies go with below links
tableau online training hyderabad
ServiceNow Online Training
mulesoft Online Training